The Chip Landscape: Geographical Distribution of Wafer Fabrication Capacity
📄 Read at OECD ↗Policy Paper No. 188 · Dec 2025 · 38 pp
Summary
OECD Science, Technology and Industry Policy Paper No. 188 — the first publication from the OECD Semiconductor Production Database, which applies the taxonomy developed in Chips, Nodes and Wafers (OECD, 2024) to actual fab-level data. It maps global wafer fabrication capacity by economy, process node density, chip type, ownership structure, and business model, using data from SEMI’s World Fab Watch (Q3 2025), TechInsights’ 300mm Watch, and the Semico Fab Database, augmented with desk research. The database covers 1,433 fabs of which 1,326 are in-production as of September 2025.
Key Insights
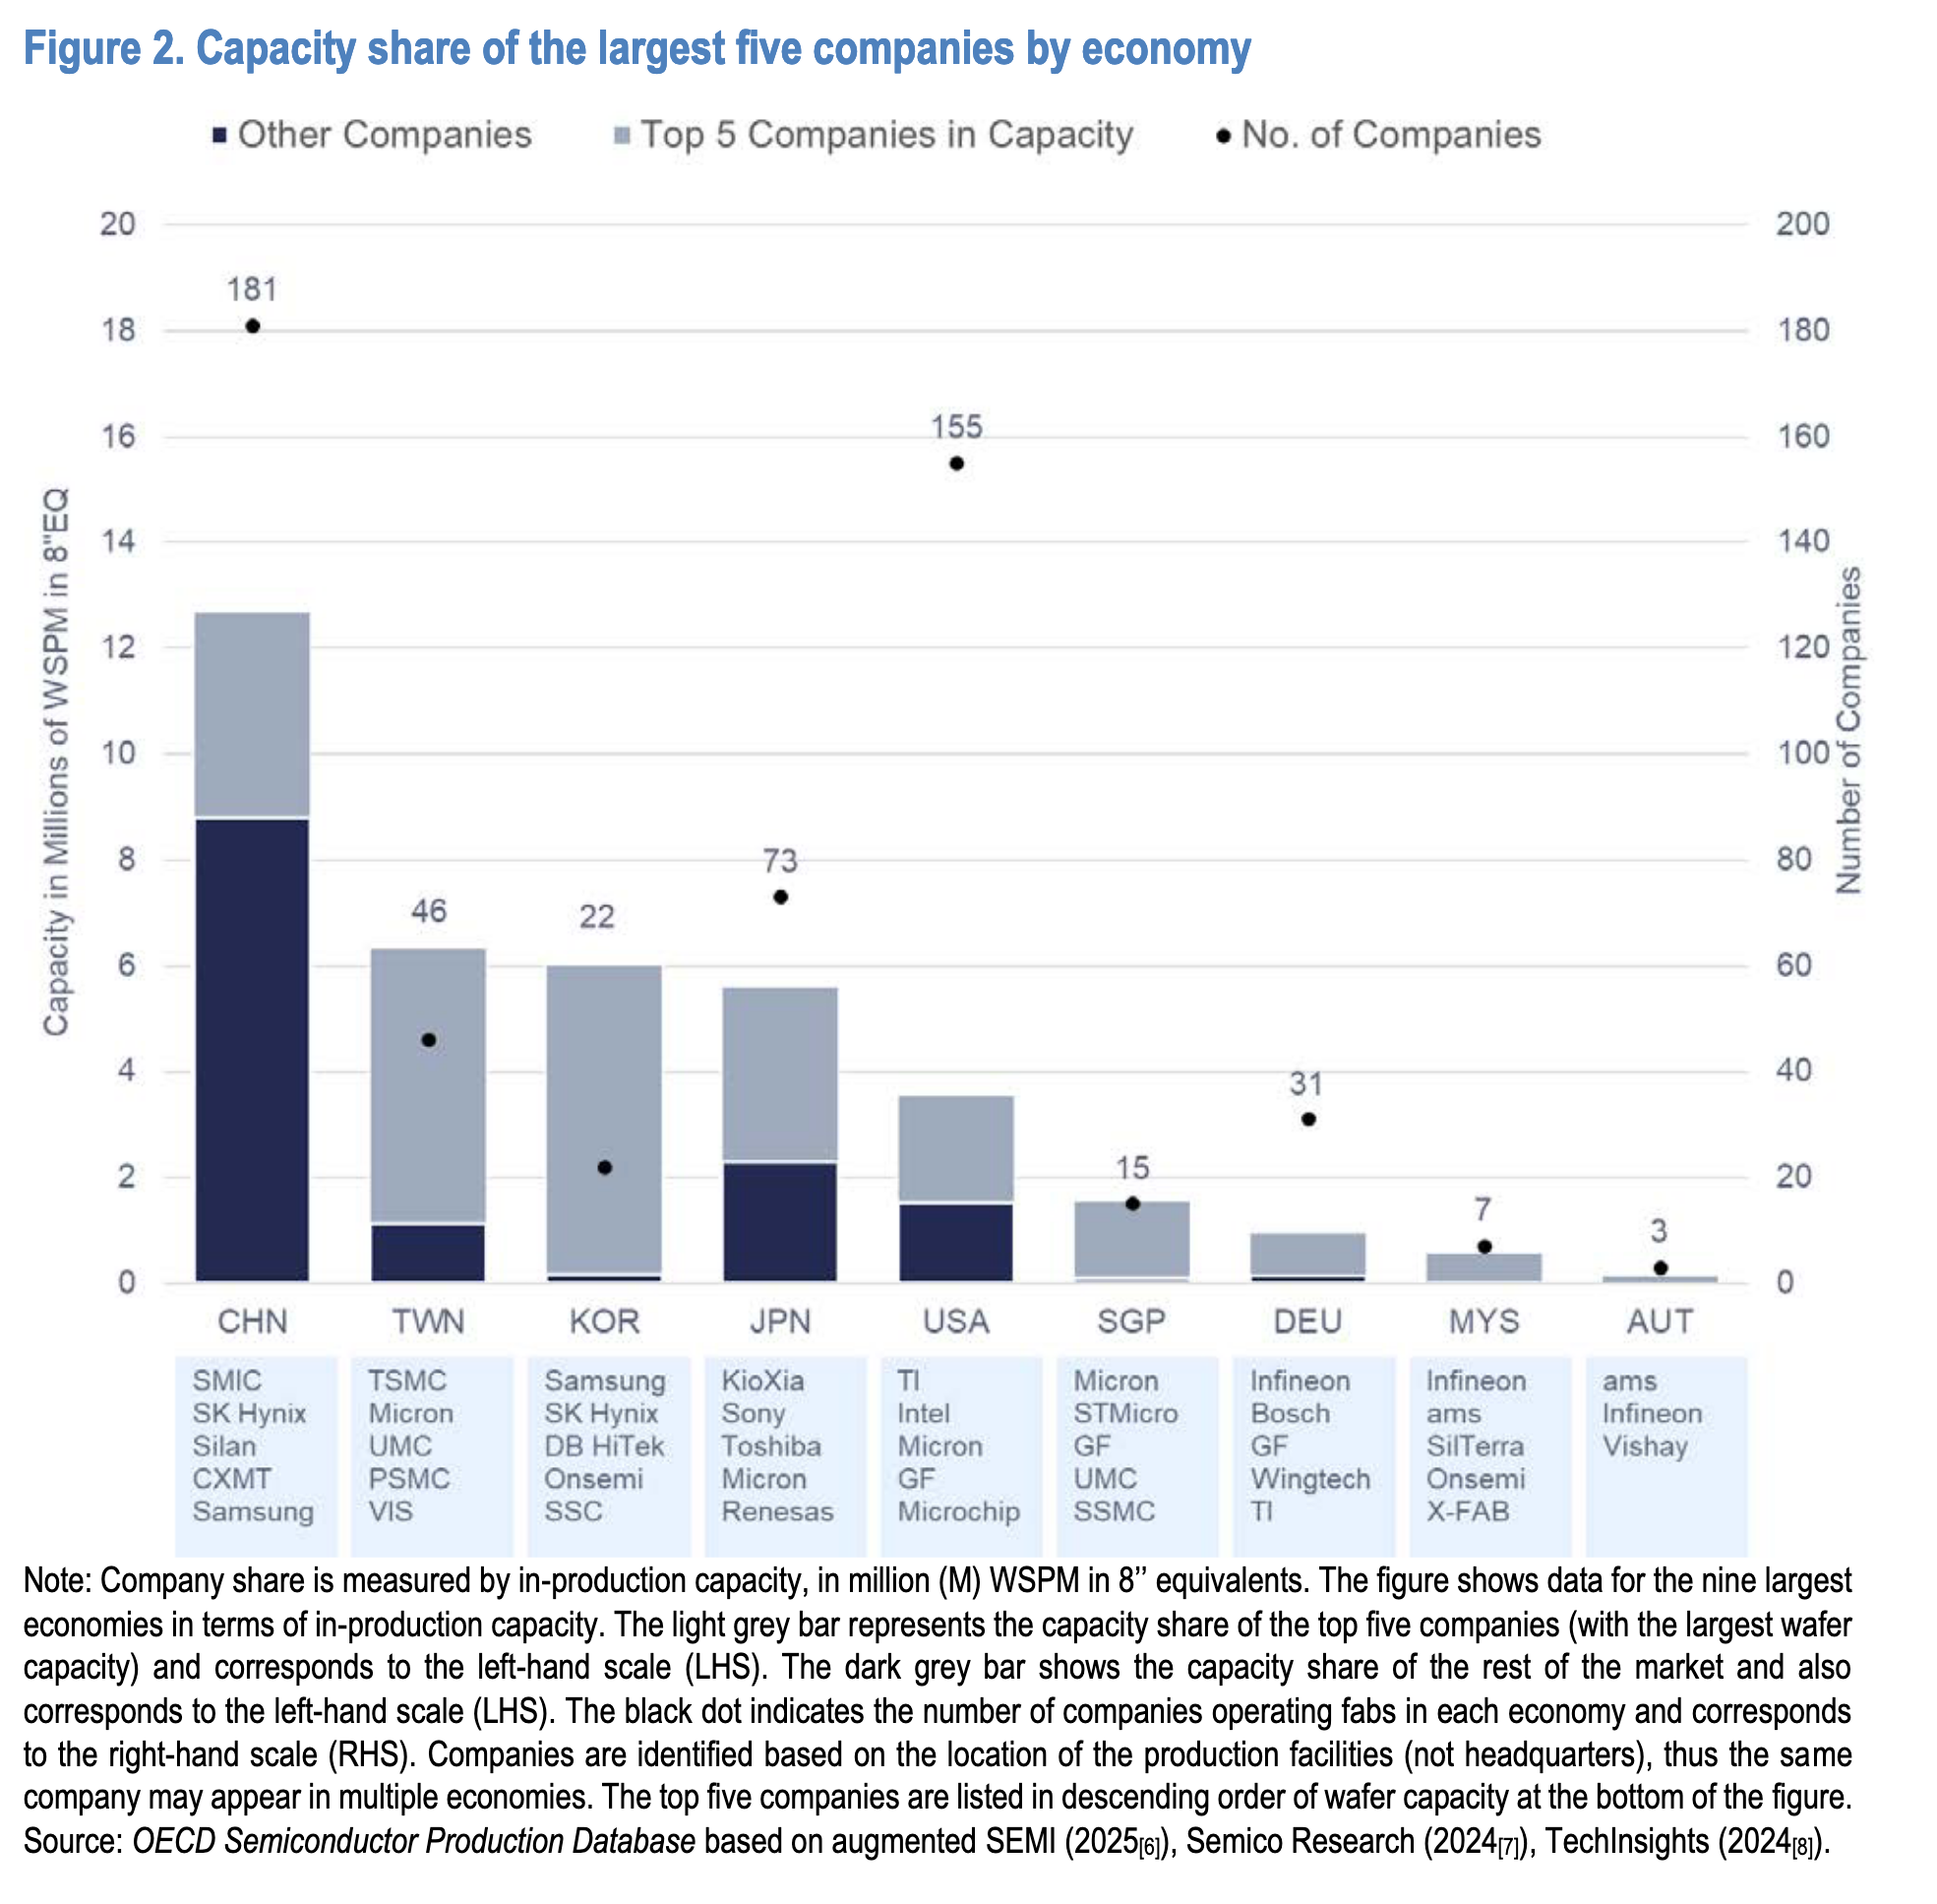
Five economies hold 87% of global in-production capacity. China, Chinese Taipei, Korea, Japan, and the United States together account for nearly 90% of installed wafer fab capacity as of September 2025. Within these economies, concentration compounds further: the ten largest semiconductor companies account for around half of total global production capacity. (p. 7, 27)
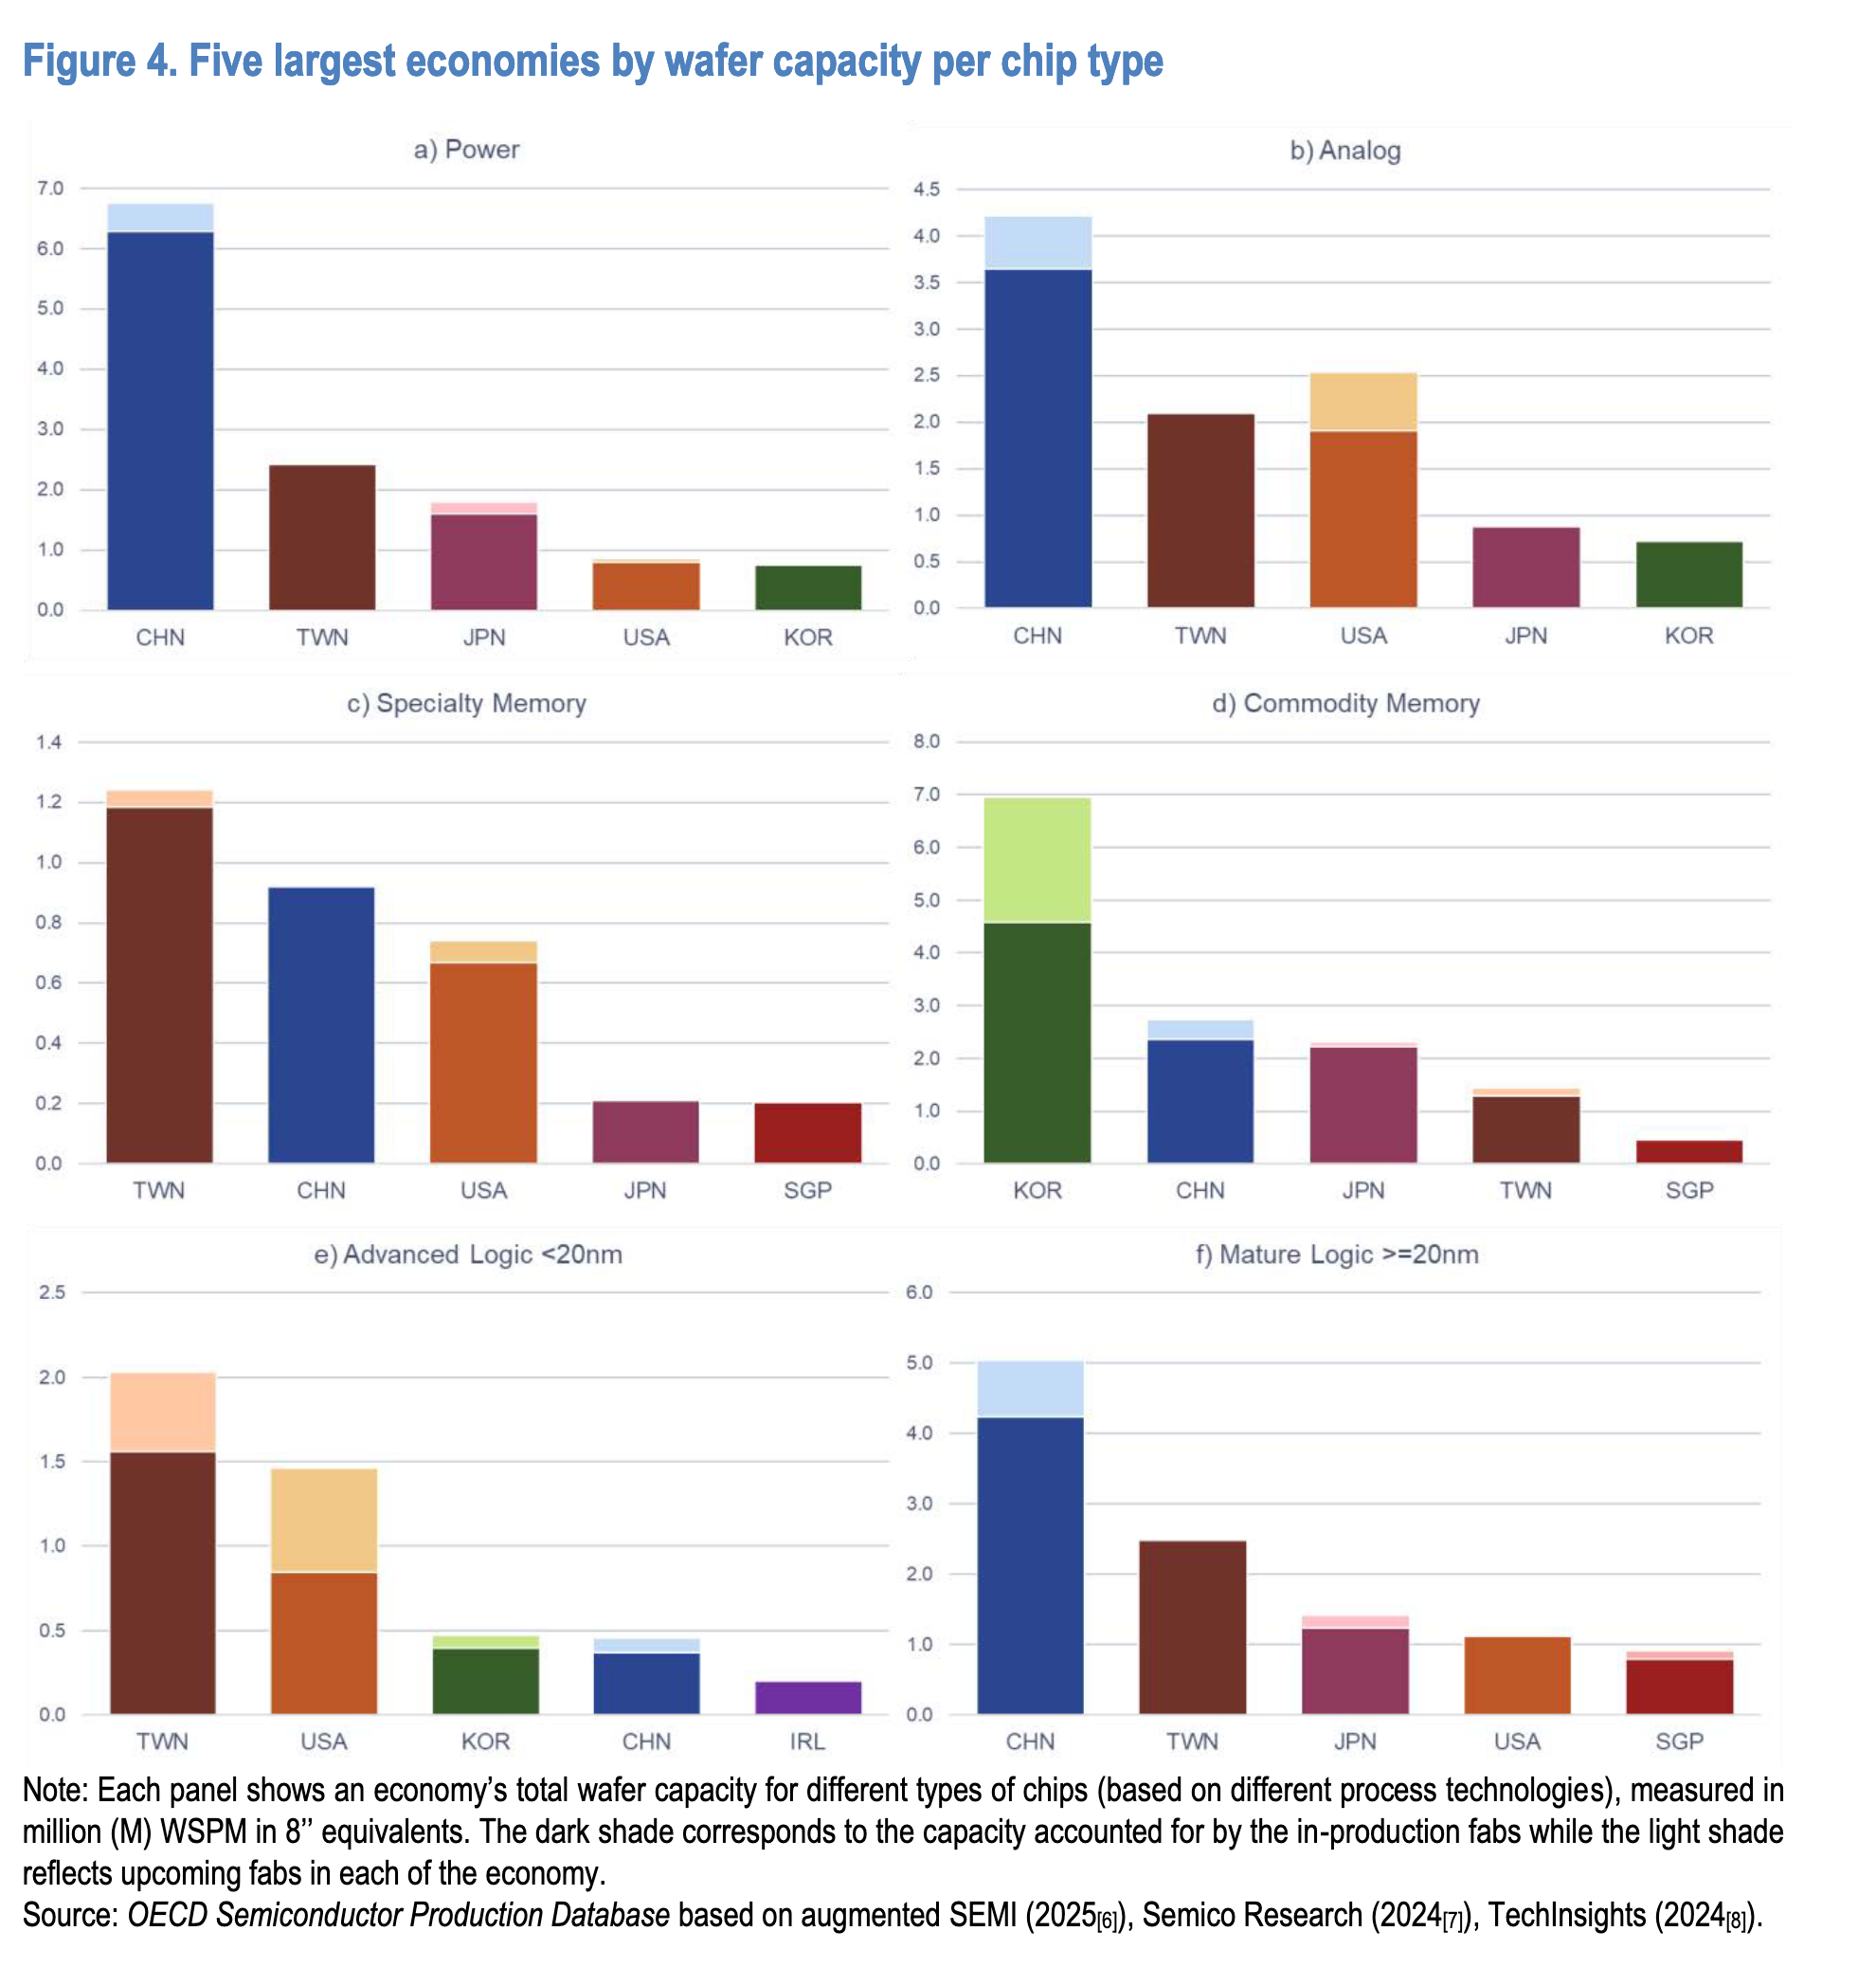
China dominates every chip type category relevant to India. China and Chinese Taipei are the only two economies in the top-five across all six chip type categories (power, analog, mature logic, advanced logic, commodity memory, specialty memory). China leads in power/discrete (6.28M WSPM), analog (3.64M WSPM), and mature logic (4.23M WSPM) — the exact three segments where India’s upcoming fabs will operate. (Figure 4, p. 18)
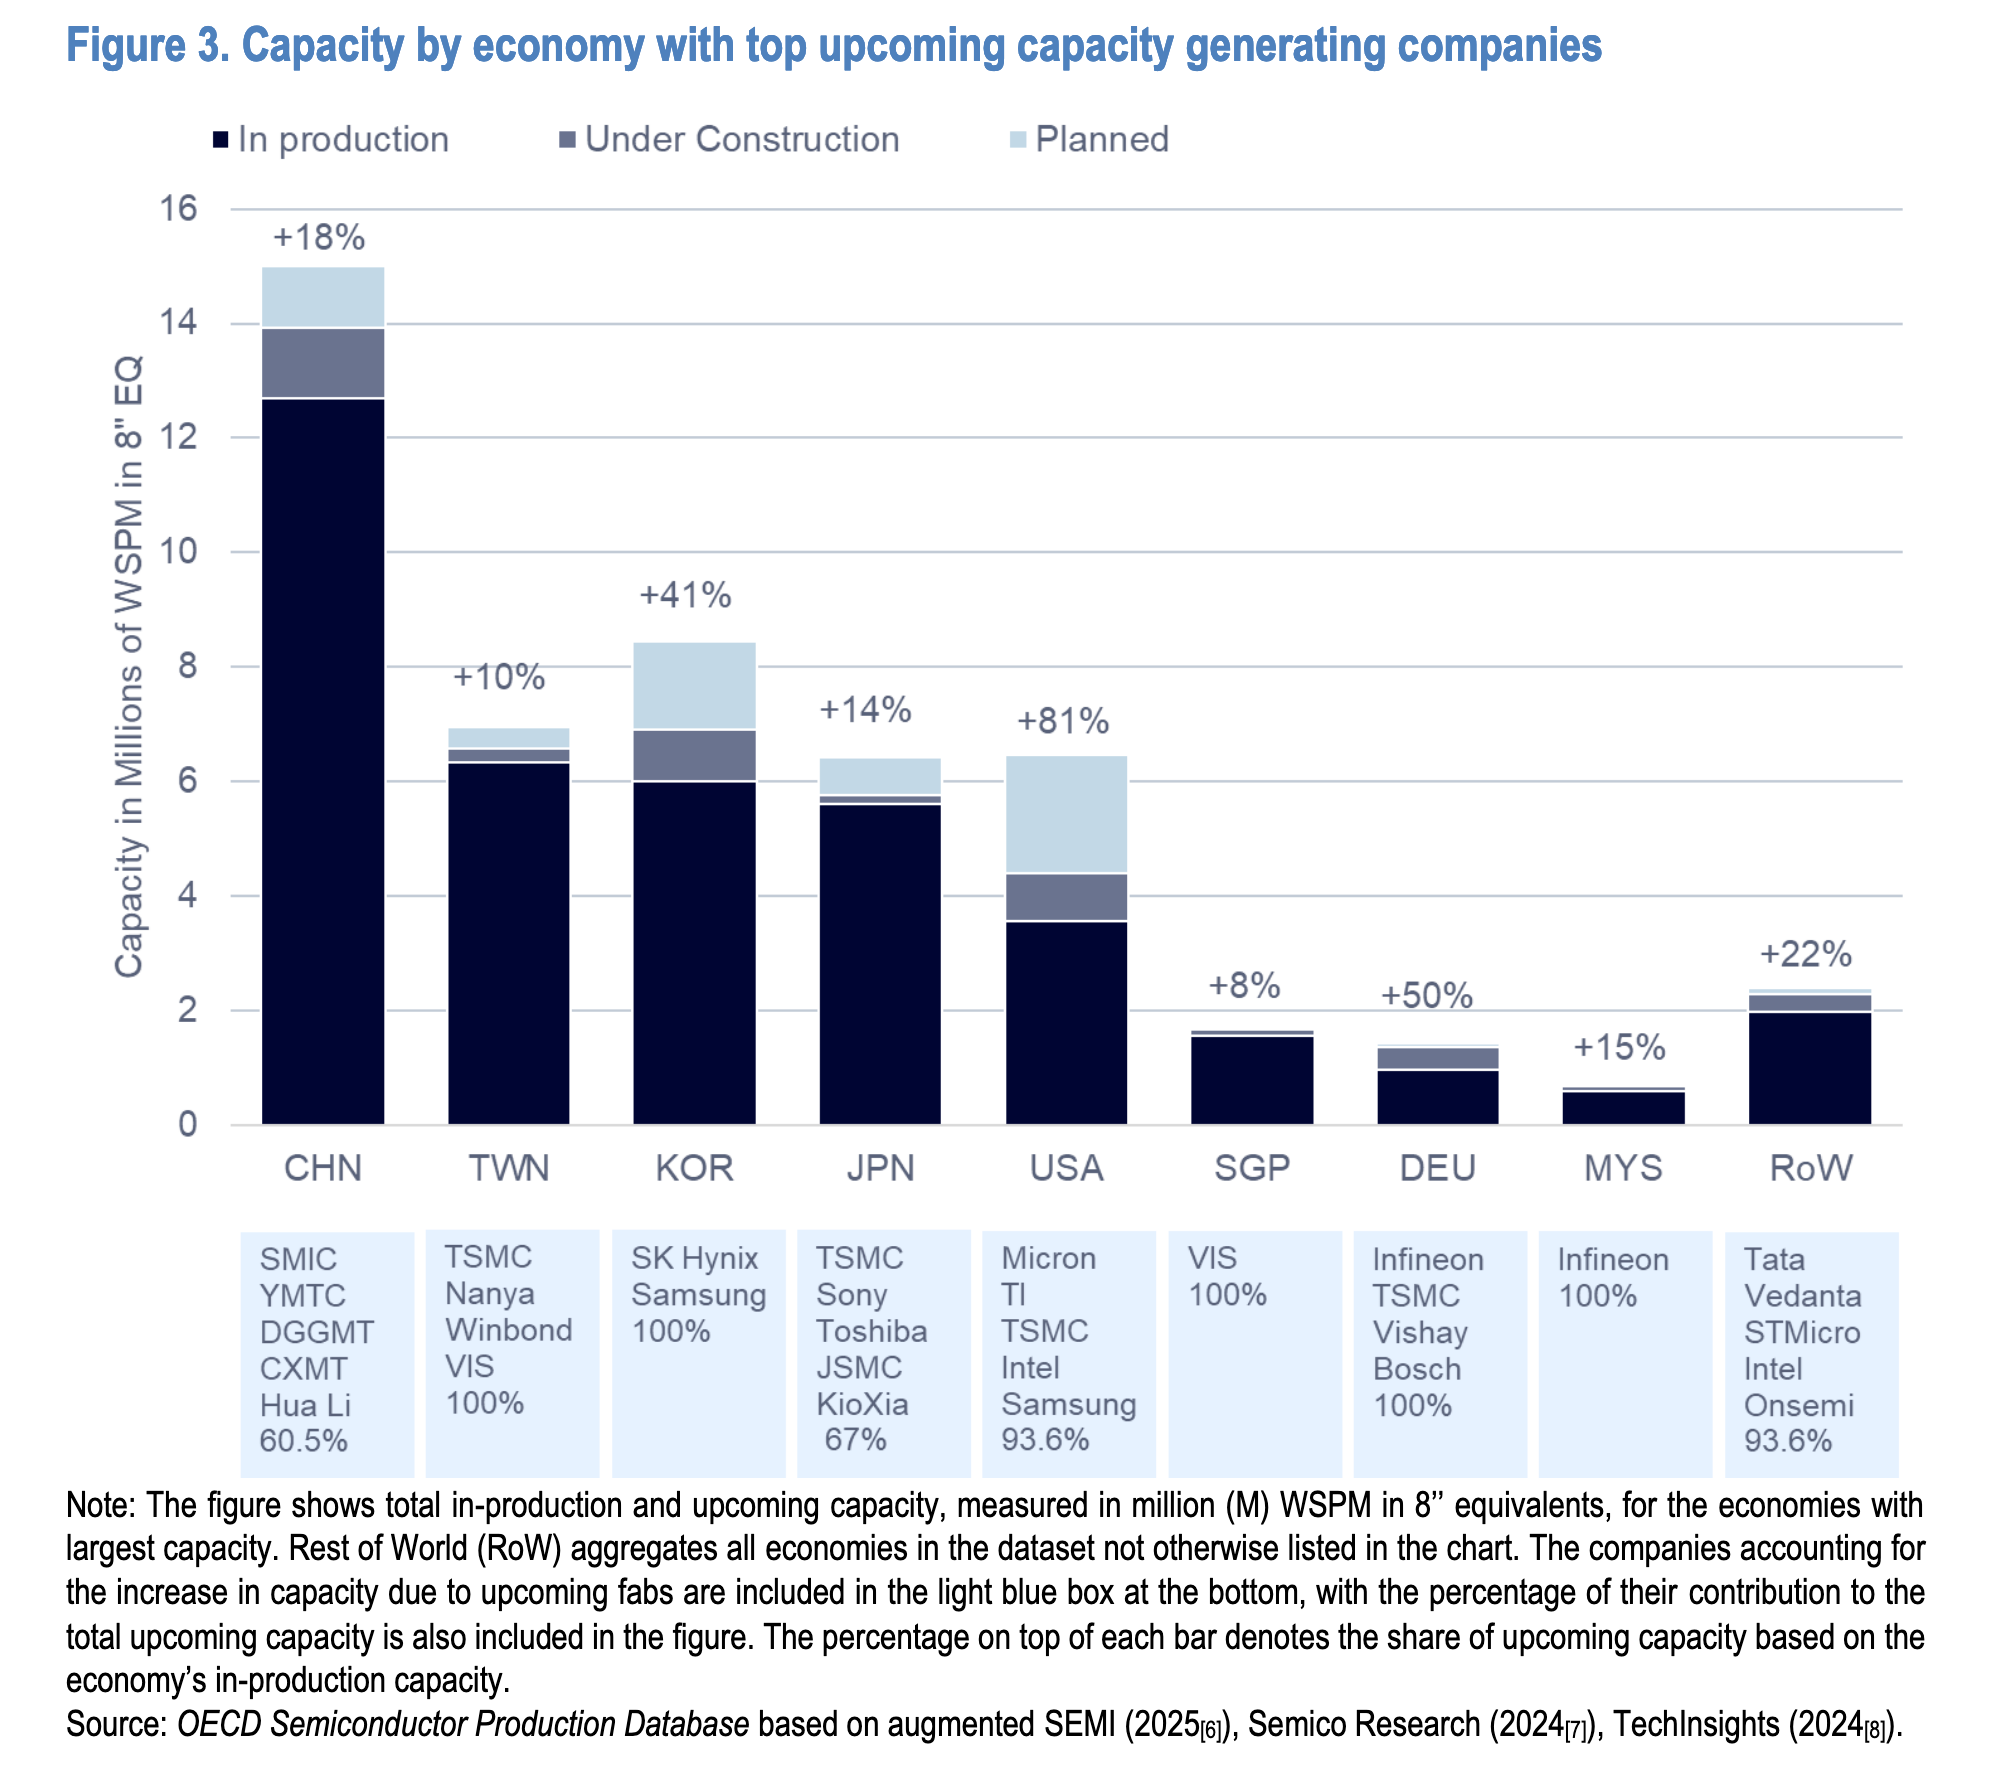
India is the largest upcoming capacity contributor in Rest of World. Figure 3 lists Tata Electronics (and, in the September 2025 data vintage, Vedanta) as the top upcoming capacity-generating companies for the Rest of World category. RoW as a whole grows +22% from upcoming fabs. This is the first time India enters the OECD’s Semiconductor Production Database. (Figure 3, p. 16)
China’s upcoming mature-node expansion alone exceeds India’s entire planned capacity 16x. China is adding 0.81M WSPM in upcoming mature logic capacity. India’s Tata/PSMC target is ~0.05M WSPM. Geography is not diversifying — upcoming investments are concentrated in the same five large producing economies. (Figure 3, 5, p. 16, 19–20)
What This Means for India
India’s fab entry is sovereign capability-building, not commercial competition. Tata/PSMC at 50,000 wspm (~0.05M WSPM) is entering a mature-logic segment where China already has 4.23M WSPM in production and another 0.81M WSPM under construction. There is no commercial story here. The right frame is supply chain security for automotive, defence, and telecom — a domestic anchor, not a market-share play. ISM communications that imply India is “catching up” in global chip manufacturing miss the point by an order of magnitude. Catching up is not the goal; having any capacity at all is.
The Vedanta listing is a stale data artefact. The OECD database (September 2025 snapshot) lists Vedanta alongside Tata in the upcoming RoW category. This reflects plans that were active at the time of data collection. Vedanta’s fab project has since been discontinued — the joint venture with Foxconn collapsed in 2023, and no credible replacement has materialised. India’s realistic upcoming front-end fab capacity is Tata/PSMC only. Anyone citing this paper’s RoW numbers for India should halve the Vedanta contribution.
China’s mature-node dominance may be even larger than shown. The OECD explicitly flags that Chinese companies have limited incentive to disclose production capabilities under geopolitical scrutiny. Commercial datasets update Chinese fab records only when public media reports new investments. The paper warns that actual wafer fabrication capacity in China is “likely higher than estimated.” If so, the already-overwhelming gap between China and India in mature-node logic is understated. (p. 35)
India has a narrow window to push the OECD for back-end statistics. This paper is front-end only — it excludes OSAT, ATMP, and advanced packaging. India’s ISM wins (Micron Sanand ATMP, CG Semi OSAT) are statistically invisible. The OECD has signalled a back-end extension is coming. MeitY and ISA have a direct interest in shaping how OSAT capacity is classified — by package type, chip category, or technology tier. India’s ISM data is already being collected; mapping it to the OECD taxonomy before the next revision cycle costs almost nothing. Not doing so means India’s genuine manufacturing wins remain invisible in the framework that Washington, Brussels, and Tokyo use for supply-chain risk analysis.
Charts

Data Extracted
In-production wafer capacity by chip type — top economies (Figure 4, p. 18; values in millions WSPM in 8” equivalents)
| Chip Type | China | Chinese Taipei | Japan | USA | Korea |
|---|---|---|---|---|---|
| Power / Discrete | 6.28M | 2.42M | 1.60M | ~0.7M | ~0.7M |
| Analog | 3.64M | 2.09M | ~1.0M | 1.90M | ~0.7M |
| Mature Logic (≥20nm) | 4.23M | 2.48M | 1.24M | ~0.8M | — |
| Advanced Logic (<20nm) | 0.39M | 1.55M | — | 0.84M | 0.39M |
| Commodity Memory | 2.10M | 1.30M | 2.10M | — | ~4.50M |
| India (planned) | — | — | — | — | — |
| Tata/PSMC (mature logic) | ~0.05M | ||||
| SiCSem (power/SiC) | ~0.005M |
Note: India values are targets from planned/under-construction fabs, not in-production capacity.
Upcoming capacity growth by economy (Figure 3, p. 16; % growth over in-production base)
| Economy | Upcoming capacity growth | Top companies driving growth |
|---|---|---|
| USA | +81% | Micron, TI, TSMC, Intel, Samsung |
| Korea | +41% | SK Hynix, Samsung |
| Germany | +50% | Infineon, TSMC, Vishay, Bosch |
| China | +18% | SMIC, YMTC, DGGMT, CXMT, Hua Li |
| Japan | +14% | TSMC, Sony, JSMC, KioxA |
| Chinese Taipei | +10% | TSMC, Nanya, Winbond, VIS |
| Rest of World | +22% | Tata, Vedanta†, STMicro, Intel, Onsemi |
†Vedanta listed in OECD September 2025 data vintage; fab project has since been discontinued.
Feature size distribution — five largest economies (Figure 1, p. 13; shares are approximate from chart)
| Economy | Dominant node range | Character of fab base |
|---|---|---|
| Korea | 6–22nm | Memory-focused; SK Hynix + Samsung DRAM/NAND |
| Chinese Taipei | <6nm + 6–22nm | Leading-edge foundry (TSMC) dominant |
| Japan | Spread across all nodes | Diversified: analog, power, specialty, logic |
| USA | Spread, leading-edge present | Diversified; advanced logic + memory |
| China | 22–45nm + 90–300nm | Mature-node heavy; broadest node range; likely underestimated |
Source
OECD (2025), The chip landscape: Geographical distribution of wafer fabrication capacity, OECD Science, Technology and Industry Policy Papers, No. 188, OECD Publishing, Paris, https://doi.org/10.1787/02dbd028-en.